Analysing 119,624 Musk Duck records on DuckDB
The Musk Duck
For starters it's a really cool duck. The Musk Duck or Biziura lobata, is a large aquatic duck found across southern Australia. They get their name from producing a strong odour from a gland on the rump. They have ashy, grey-brown plumage and a fan tail, that aids in their identification. They frequent deep freshwater bodies with surrounding vegetation.
This is a male musk duck, easily determined by the large leathery lobe under the bill that he can inflate during courtship displays. He also fans his tail and splashes about whilst whistling and grunting! - a very lively display for any on-looking female.
 The male is the largest and heaviest duck native to Australia - up to 3kg. Out of the diving ducks, it may even be the largest in the world.
Now to the female. They are smaller with a less conspicuous lobe, have similar ashy plumage and a dark grey bill. Juveniles resemble a smaller, female musk duck.

These great images are all credit to JJ Harrsion who captured these images at Lake Wallace, NSW and uploaded them to wikimedia here (male) and here (female). I write this blog post in part as I saw both the male and female Musk Duck for the first time at my local lake on 13/06/26. Although my images were nowhere near as good.
The musk duck is quite distinct in evolutionary terms, being distantly related to any other duck, and quite hard to place systematically, with more information here. There used to be a closer relative, the New Zealand Musk Duck, but this became extinct was only discovered from fossil records. I am unsure if this means we can consider Biziura a monotypic taxon or not, but regardless, they are the only living member of the genus Biziura.
What is DuckDB?
DuckDB is an open-source column-oriented Relational Database Management System. It uses SQL (or a slightly modified version of it) to run queries on the database. It is very neat and whilst I don't understand all the software terminology, I get the impression it is really powerful at what it does. Also everything is a table - I mean absolutely everything is a table. If you love tables then DuckDB is for you.
What does impress me is the case-insensitivity and how quick it is. Using SQL didn't take too long to get my head around. In many ways I think it's simpler, yet every command is much more heavy if that makes sense. Finally, it's called 'DuckDB', so it's gotta be a duck I look at. I haven't written about ducks on this blog yet, so let's put the duck in DuckDB.
My brother recommended DuckDB to me, so thanks heaps to him.
What I wanted to do
My idea was to see if observations of musk ducks were increasing or declining over time. To do this, I needed a large dataset to test DuckDB. I immediately knew the Atlas of Living Australia (ALA) would be the place to find such data. ALA is publicly-available, easy to download and a reputable data source.
Once you get all the records, observe how frequent observations of musk ducks are over time, this may give an indication on whether the overall population is in decline or not. I also wanted to filter them by location, to gain a more detailed understanding of their distribution.
Here is the musk duck ALA occurence data that I used.
Loading up the CSV
Honestly importing the dataset was half the battle. Not because it's difficult, I just didn't know what I was doing. I know DuckDB has a pretty good csv reader in comparison to other alternatives. Also it was my first time running this all from a terminal without using a UI, so it took a bit of getting used to.
Results
When I downloaded the occurrence dataset, there was a total of 119,624 records of musk ducks. Of these records, only 115,232 had the observation year. Fewer still had both specific location data (longitude and latitude) and the observation year - only 115,161 records.
Fortunately almost all records were given a state label, so we can gain a general understanding of the distribution Australia-wide.
No. of musk duck records per state:
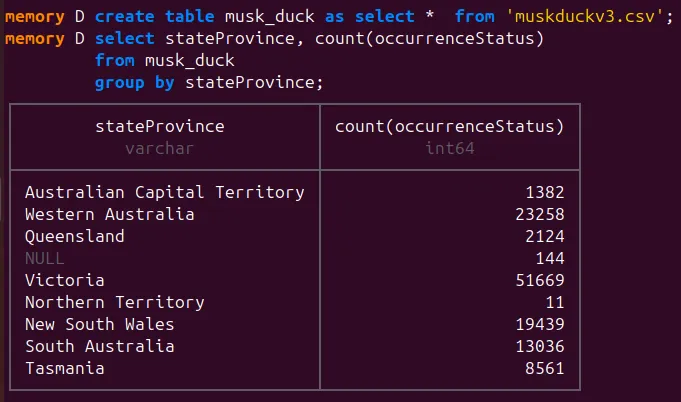 Victoria has more than double the number of musk duck records (51,669) than any other state. Interesting. This is followed by Western Australia (23,258). But why so many more in Victoria?
I then made some summary statistics. I first looked at two variables, observation year (I named 'yearofduck'), and the longitude. It's small, but here you can see the summary statistics for the longitude and observation year:
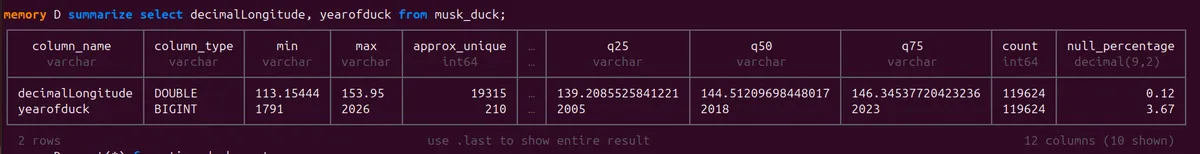 A cool stat is that 50% of all musk duck records occur east/west of 144.51 degrees longitude. So you can pretty much draw a north-south line at Avalon Airport. Further, 50% of records are after the year of 2018, already giving a hint into the observation rate over time.
This very simple analysis took a fraction of a second to compute, and highlight the advantages of DuckDB. Trying to do this in excel would be a very cumbersome process, with a lot of scrolling. You can see all the code I used. I am hesitant to say code, I mean it's 7 words that can make a summary table, or 14 if you want to import the csv file. Very simple.
East vs West Musk Ducks
When you view the occurrence records on a map (as best done on the Musk Duck ALA webpage), you can see there is a clear divide between Eastern and Western Australia. I wanted to investigate if any differences exist between these two groups.
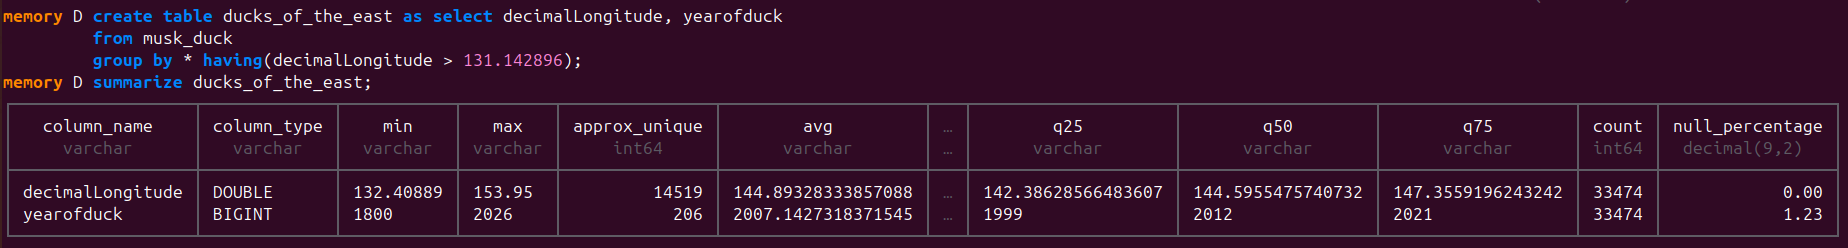
To do this, I filtered my results to see only records with a longitude > 131.142896 (the eastern records), or <131.142896 (the western records). 131.142896 degrees longitude is the northern-most point of the Great Australian Bright, with the dividing line located at the Pearson Sandhills in the middle of the Nullabor.
Musk ducks of the East:
I did the exact same thing but for all values < 131.142896.
Musk ducks of the West:
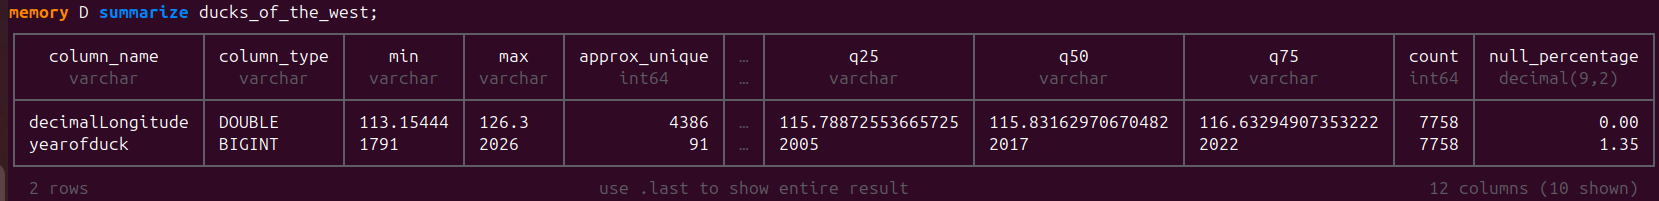
It becomes clear when looking at the count, Eastern Australia has 4.3 times more records than Western Australia (33,474 records compared to only 7758 records). Note this only includes records with known co-ordinates (latitude and longitude), so does not match with the state-based totals previously. Again this struck me as odd. Why so many more records in the east half of Australia?
But just looking at the count won't tell the full story. Time is important too.
Musk ducks over time
Despite the numbers being barely readable, I thought I should show you the histogram feature inbuilt into DuckDB.
The count of musk duck records for each year:
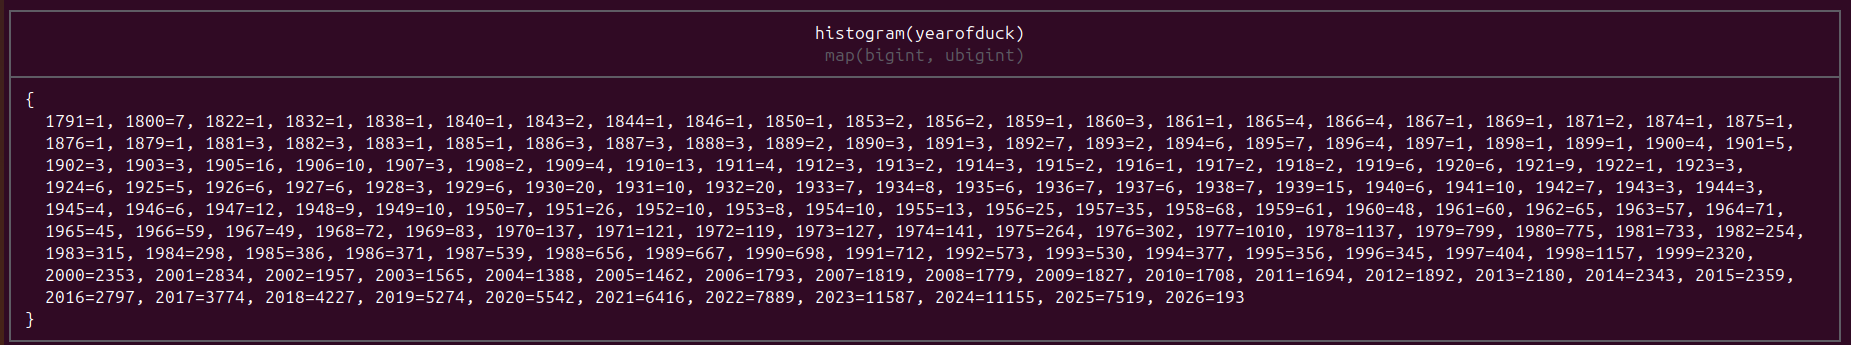 I don't expect you to read the histogram, but there is a clear increase in the count of musk duck records overtime.
Then I made a histogram comparing east and west records, counting the number of musk duck records every decade starting from the 50s (to make it visually easier to read):
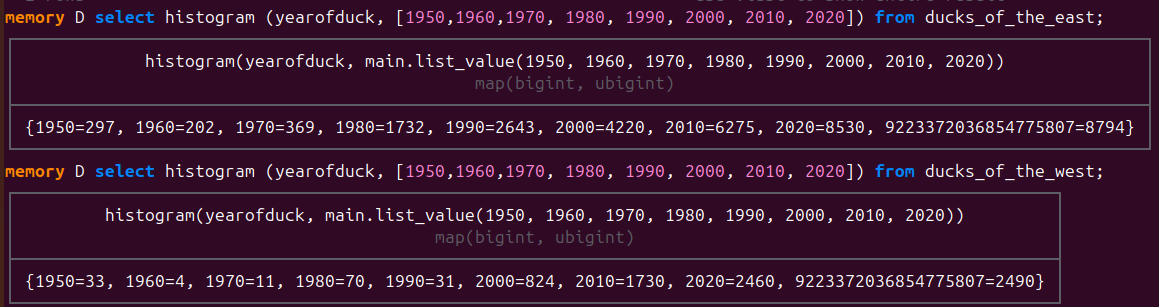
We can see the clear increase in the number of records every decade to present. Another major difference lies in the historical records. In the west, there were very few records pre-2000.
To stop beating around the bush, why in the west are there less records? And why are there way more recent records than old records?
Discussion
I believe there is a human observation bias found in the dataset. There are not as many people recording birds in the west. This also answers why Victoria had more than double the number of observations compared to any other state/territory. The data reflects the human population. Many more millions of people live east of Great Australian Bright, and many more millions of people live in Australia now than in the past.
Furthermore, historically all the universities and scientific institutions that record such data were in major cities, Sydney, Melbourne, Brisbane, Adelaide - all of which are east of Australia. I don't want to give all the credit to these institutions though... especially with numerous conservation organisations and recent advancements in technology.
But can I gain any insight into the real-world musk duck population trends? I started this project wondering if the overall population of musk ducks is increasing or decreasing. If I am assuming an increasing rate of musk duck observations = increasing musk duck populations, then from the data alone, there is nothing to suggest that the musk duck population is in decline. You could argue it is increasing. But does more records = more musk ducks?
I don't think you can make such a link in my case. The reality might be grimmer. Even though the Musk Duck is least concern on the IUCN Red List, it's population is decreasing. Birdlife international put it's population estimate at 23,000 individuals. But that is not to say occurrence data is useless. Occurrence data on any given species will reflect real-world populations. It just can be succeptible to bias.
Thanks to organisations such as Birdlife Australia, citizen science, (and the increasing human population), many more observation of musk ducks are occurring every day. In fact, in the time it has taken me to write this post, the number of Musk Duck records on ALA has increased from 119,624 to 119,768! Having such data is valuable and will help us make better informed decisions.
Why analyse large datasets?
There are many benefits of analysing large datasets over small datasets.
The good thing about analysing so many records is that you have data that you can work with. Whist not evident in my musk duck data, if there was a real decline in observations, this may reflect a real-world decline in the population. You may discover other trends in your data, start understanding how these change over time. With data you could help inform conservation efforts to protect areas with declining populations. Alternatively, you could also locate where population strongholds still exist.
For a species that is already critically endangered you cannot do this. The problem is two-fold as the rarity of a species makes you unable to collect enough data, consequently rendering it difficult to discover meaningful insights from the data you collect. For comparison, the Victorian Earless Dragon Tympanocryptis Pinguicolla has 59 records on ALA. Due to such a low number of records, there is far less less certainty behind any population estimate, or in understanding where populations are located.
All up there are 119,624 records of musk ducks, each a row of data. Is this a large number of rows? I mean it really depends on your definition of large. It's large by the excel spreadsheet sense. It certainly would be very unyieldy to navigate in excel, but in the computational sense, I don't think this is large. The csv file I used was 16.7MB in size. I would be keen to one day try and combine multiple datasets. Scale this up and analyse massive amounts of data
Final thoughts
On ALA, when you view occurrence data at a glance (not just for musk ducks but for any species), all the dots appear equal to one another, however take it with some caution. The frequency and location of records may be biased by human populations and where humans live. Further, records can have drastically different ages. All of which are important for how you perceive occurrence data and the distribution of any given species. Understanding occurrence data is important for conservation. Occurrence data is relied upon heavily in making assessments on the likelihood of species existing in a given area. Such data may even halt construction, if there are protected species, known to exist in the proposed area.
DuckDB is a great tool that I hope to use again. DuckDB is made for wrangling large amounts of data. It is able to query, analyse, filter and order such data with ease.
 A male Musk Duck splashing about! Another courtship display here, with the male kicking his feet - I have never seen a duck do this before! They usually just float on the surface yet here it's almost doing freestyle or something! Image source from wikimedia and credit to Mike, of Mike's birds who captured this image.
My own musk duck photos:
 |
 |
Images taken 13th June 2026.